In this article, I explain why it is so difficult to get weather information about snow conditions and the amount of snow on the ground. I recommend a weather application that will provide you with as much information as possible.
How is it that we live in Quebec in a country of snow and that it is not possible to know exactly how much snow is on the ground?
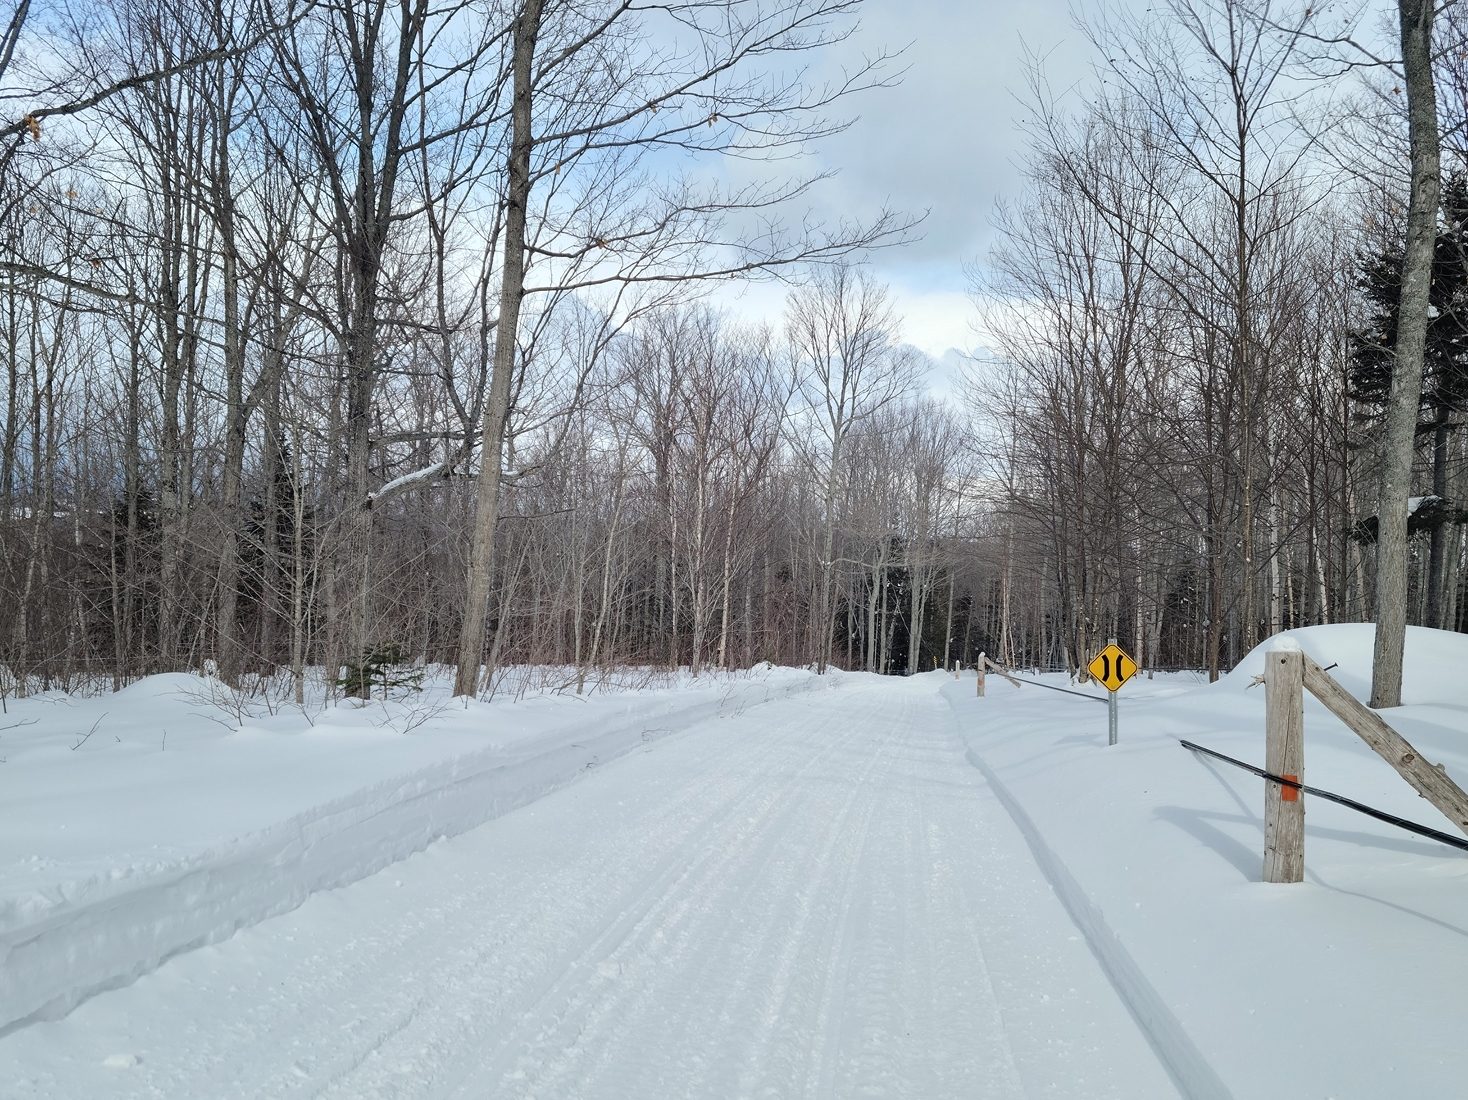
In our snow country, it’s easy to get the forecast of upcoming snow, but once it falls, it’s hard to know exactly how much snow has fallen. It becomes unavailable data. Sometimes during exceptional snowstorms, we try to know exactly how much snow has fallen. This is always difficult to obtain. Rather, the images will speak and show the amount of snow that fell on the ground. Again, the amount of snow that fell does not equal the amount of snow that accumulated on the ground. As the days go by, the snow compacts and depending on the weather conditions (rain, cold, new snow), the accumulation on the ground varies.
Several years ago, The Weather Network gave us this information based on information received from Environment Canada. Today, nothing. Occasionally, we find generic maps and fragmented information from a few labels giving the amount of snow on the ground for the whole of Quebec.
ECCC-SMC Weather data is difficult to collect
There are three main sources of snow data on the ground in Quebec, the automatic stations of Environment and Climate Change Canada – Meteorological Service of Canada (ECCC – MSC) which are equipped with ultrasonic snow sensors (SR50), the stations operated by NAV Canada (NAVCAN) and the stations of the network operated by the Ministry of Environment and Climate Change (MELCC) of the Government of Quebec (GOVQC).
In the early 2010s, the stations of the Quebec (and Canadian) airports are gradually being transferred to NAV Canada. ECCC-SMC was therefore posting NAV Canada station data on their website, however, they could not make any promises regarding NavCan data, as they are a partner and their station data has not undergone any regular quality control on their part. There is no other source of snowfall data, as the automatic stations cannot differentiate between rain and snow, however, only some of the ECCC-SMC automatic stations offer snow on the ground data (cm).
Quebec Government Weather Website
However, one of the ECCC-MSC partners, the MELCC (GOVQC), does send them some data from some of their stations. The data from the MELCC is usually sent with a few months’ delay.
You can access these data directly by visiting their website: http://www.environnement.gouv.qc.ca/climat/donnees/OQcarte.asp
Click on the “Péhnomène” drop-down menu at the top left and choose ” Neige au sol “. Then you click on one of the colored dots located at the desired location, and you will obtain the amount of snow on the ground for this station. As you will see, many stations are not available.

Calculating snow on the ground
Unlike rain, which is easy to collect and measure, snow has many forms and densities and is difficult to measure. Powdery snow, wet snow, snow fog, wind. Here is an excerpt from the ECCC-SMC Surface Weather Observations Manual if you want to track the amount of snow on the ground. “…the amount of snow that has fallen during a given period should be determined by measuring the height of new snow with a ruler at several locations and averaging the measured heights of new snow.
Whenever possible, the depth of new snow should be measured at locations where the fallen snow has not been disturbed by the wind. When the snow has been blown away, the height of new snow should be measured at drifts and exposed areas, and the observer should estimate the height of snow that would have accumulated had it not been windy while considering the relative proportions of drifts and exposed areas.
When the snow melts between observations, the amount of snow remaining at the time of observation will not be the total height of snow that has fallen since the last observation. Under these conditions, the reported height will be an estimate of what the snow height would have been had there been no melting…”
NOAA weather website
The NOAA or the National Oceanic and Atmospheric Administration, the official website of the United States government is a reference site for snow on the ground information. Again, these are American maps, but by extension, given our proximity to the United States, we can have a reasonably accurate map of our snow conditions on the ground. Click here.

My recommendation
After exploring several sites, I recommend the free Windy.com site. It’s an interactive site that requires a bit of appropriation, but when well mastered, it gives a lot of information on forecasts, and current and past weather conditions. It is possible to use it on a computer and on a smartphone. Here is my way to easily get the amount of snow on the ground with its density for a specific location on computer navigation. For a cell phone, it’s similar with the necessary adaptations.
Steps to create an account
- Create an account to keep your favorites;
- In the menu on the left, choose your preferred parameters (metric or English system or a mix of both);
- Zoom in on the map to better see the place you are interested in;
- When you click with your left mouse button, a pointer appears with information that corresponds to the highlighted item in the right part;
- You can click on other elements in the right part and you will see the information of the pointer changed and the map adjusted to the new information with a new legend;
- For the snow on the ground, you must add a new map by clicking on “More maps…” at the end of the elements in the right part and you activate the “Snow depth” switch. You will then find this clickable item in the list of elements on the right and you will be able to click on it and have the information on the pointer;
- By moving the pointer, you will be able to see the snow depth on the ground for the desired part of the country;
- By clicking on the “Play” icon (arrow to the right) at the bottom left, you will see the weather situation scroll by hours and days according to the weather forecast;
- If you have a favorite place, you can add it by clicking on the small down arrow on the pointer. At that time, the place is added on the top left bar and you click on the small heart to become a favorite. A complete weather forecast is shown at the bottom of the map. If the pointer has disappeared, you can click on the right button and click on “Show weather pointer”.
- You also have the possibility to compare several weather forecasts from different weather services. Just click on the “Compare” button at the bottom center.
In summary
As you will see when you get familiar with this application, you can use it to see the movement of different weather systems and better plan your travels. Obviously, these are only forecasts and computer models that improve the information to make better-informed decisions, but it is not infallible, it is up to you to use this information with care.
Enjoy the season and have a great ride!